SinterPixels Demos Part 6: A Parametric Equation
Next up in examples of what you can do with SinterPixels, my new app in the macOS App Store: drawing a parametric equation:
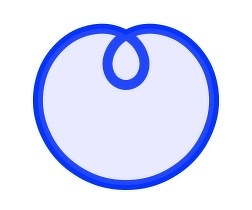
This is a curve where x and y are defined by functions of a third variable, t
x(t) = cos(3t) * sin(t)
y(t) = sin(3t) * sin(t)
To draw this line, we’ll make a SinterPixels path. SinterPixels paths are defined by a set of path anchors, each of which has a position and a slope. So, to define the path, the script will step through values of t from 0 to pi, in increments of pi/18. At each of the 19 points, we’ll calculate the position of x and y, and also the slope of the function at x and y.
First let’s define helper functions to calculate sine and cosine. There aren’t built-in AppleScript versions, but its easy to call the JavaScript versions:
on sin(x)
return run script "Math.sin(" & x & ")" in "JavaScript"
end sin
on cos(x)
return run script "Math.cos(" & x & ")" in "JavaScript"
end cos
Now let’s define our function. We’ll make a coord(t) function to calculate the x and y coordinates at a given time, and a separate derivative(t) function that calculates the slope at any given t. Because the derivative function needs to call the coordinates function, we package them together in a script object called “func”
script func
on derivative(t)
set coordAtTMinusDelta to my coord(t - 0.01)
set coordAtTPlusDelta to my coord(t + 0.01)
set dx to (x of coordAtTPlusDelta) - (x of coordAtTMinusDelta)
set dy to (y of coordAtTPlusDelta) - (y of coordAtTMinusDelta)
return {dx:dx, dy:dy}
end derivative
on coord(t)
set rad to (my sin(t)) * 100
set x to (my cos(3 * t)) * rad
set y to (my sin(3 * t)) * rad
return {x:x, y:y}
end coord
end script
Note that we’ve multiplied the x and the y by 100 to make the graph bigger for drawing.
Now, defining the path is done with a loop that makes 19 anchor points, and then uses the anchor points to make a path object:
tell application "SinterPixels"
set anchorData to {}
repeat with a from 0 to 18
set t to a * 3.14158 / 18.0
set nthPos to my func's coord(t)
set nthSlope to my func's derivative(t)
set anchorData to anchorData & { { position :{ x of nthPos , y of nthPos }, slope :{ deltax : dx of nthSlope , deltay : dy of nthSlope }}}
end repeat
set theDoc to make new document with properties {height:300, width:300}
tell theDoc
set thePath to make new path with properties {anchor data:anchorData, position:{0, 0}, line width:10, color:blue, fill color:{0.5, 0.5, 1.0, 0.2}}
end tell
end tell